2024. 10. 15. 18:40ㆍComputerScience/ProcessingInMemory


How can i specify an area of code to instrument it by pintool?
There are four levels of granularity in Pin: routine, instruction and image, trace. Can i specify an limits/area to start and stop inserting instrumentation code. may by like directive like ( # start
stackoverflow.com


# 자주 썼던 명령어
- objdump -t pinatrace.so
- dump 뜨는 명령어 -> 심볼 테이블을 통해 함수의 name을 얻을 수 있다.
- 소스코드 수정 시, make로 .so file 업데이트한 다음, dump 뜨면 됨
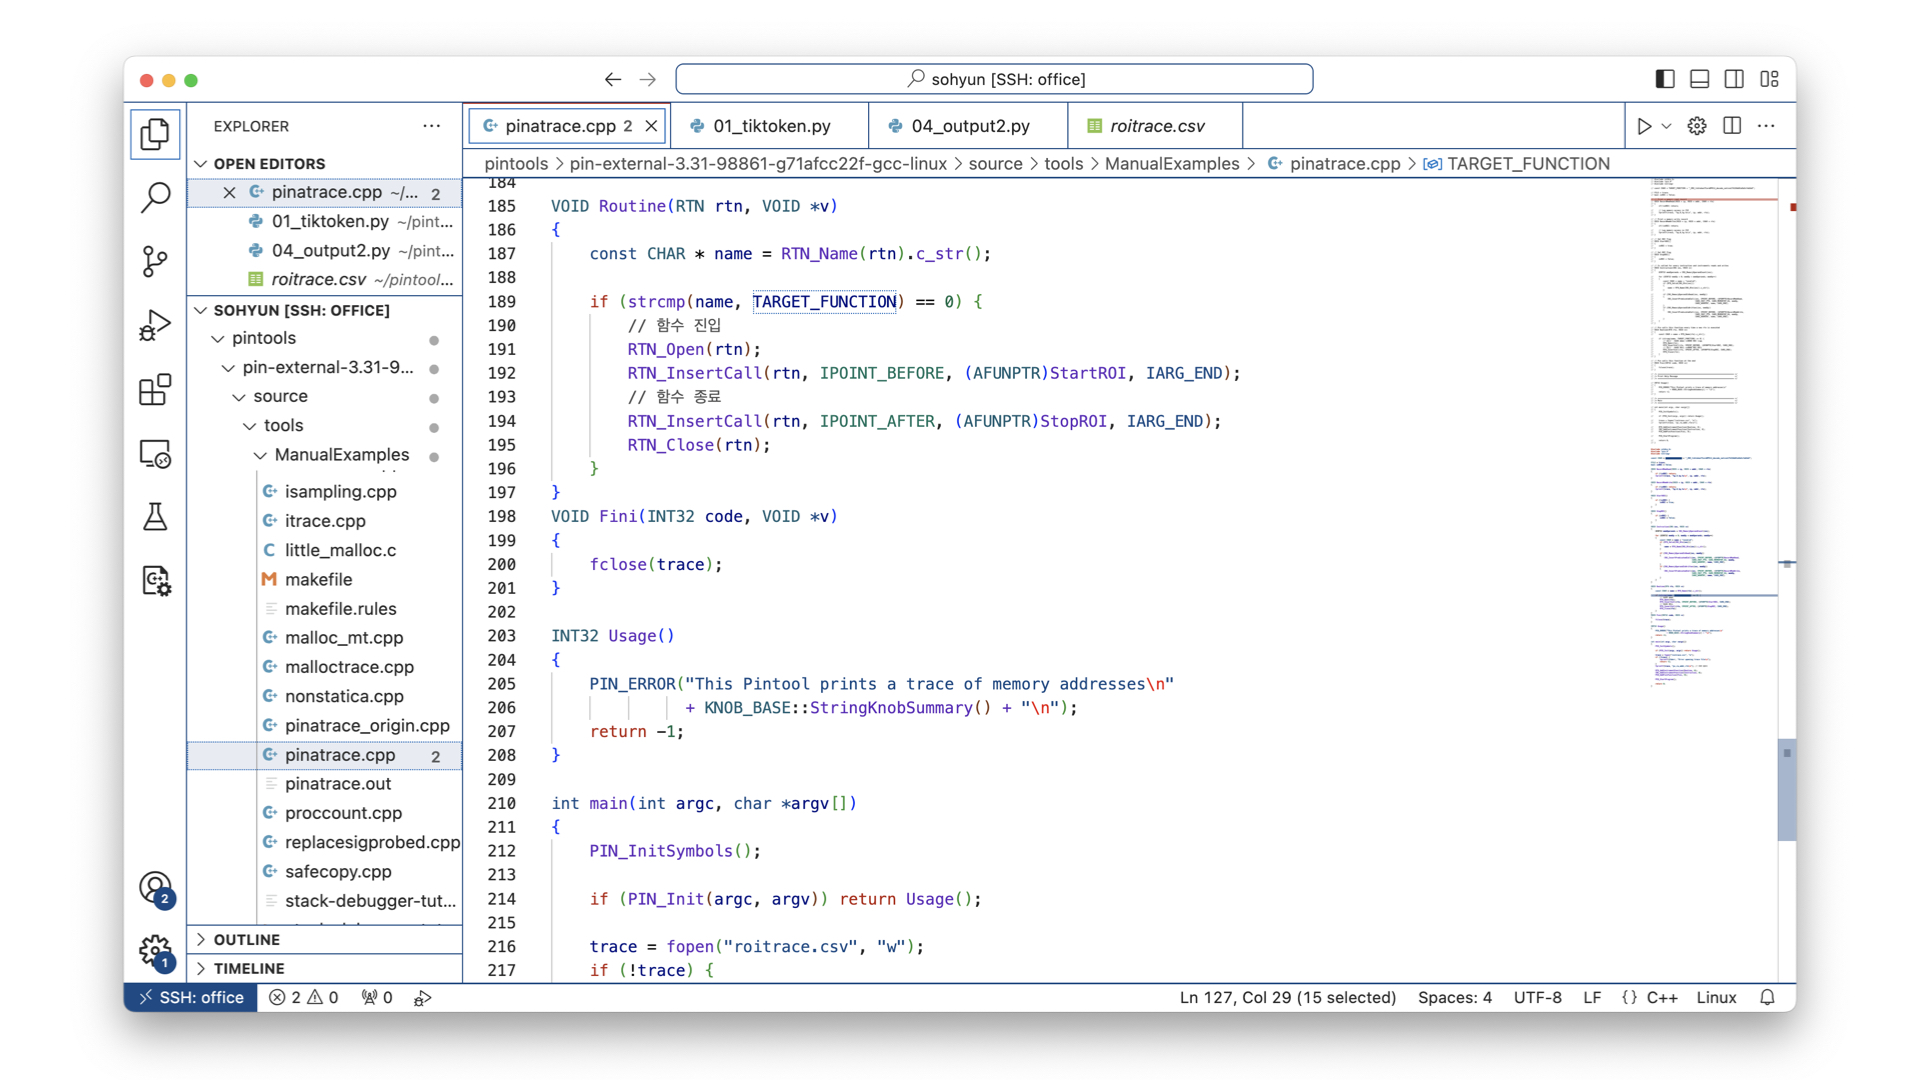
- pin -t pinatrace.so -- python 01_tiktoken.py
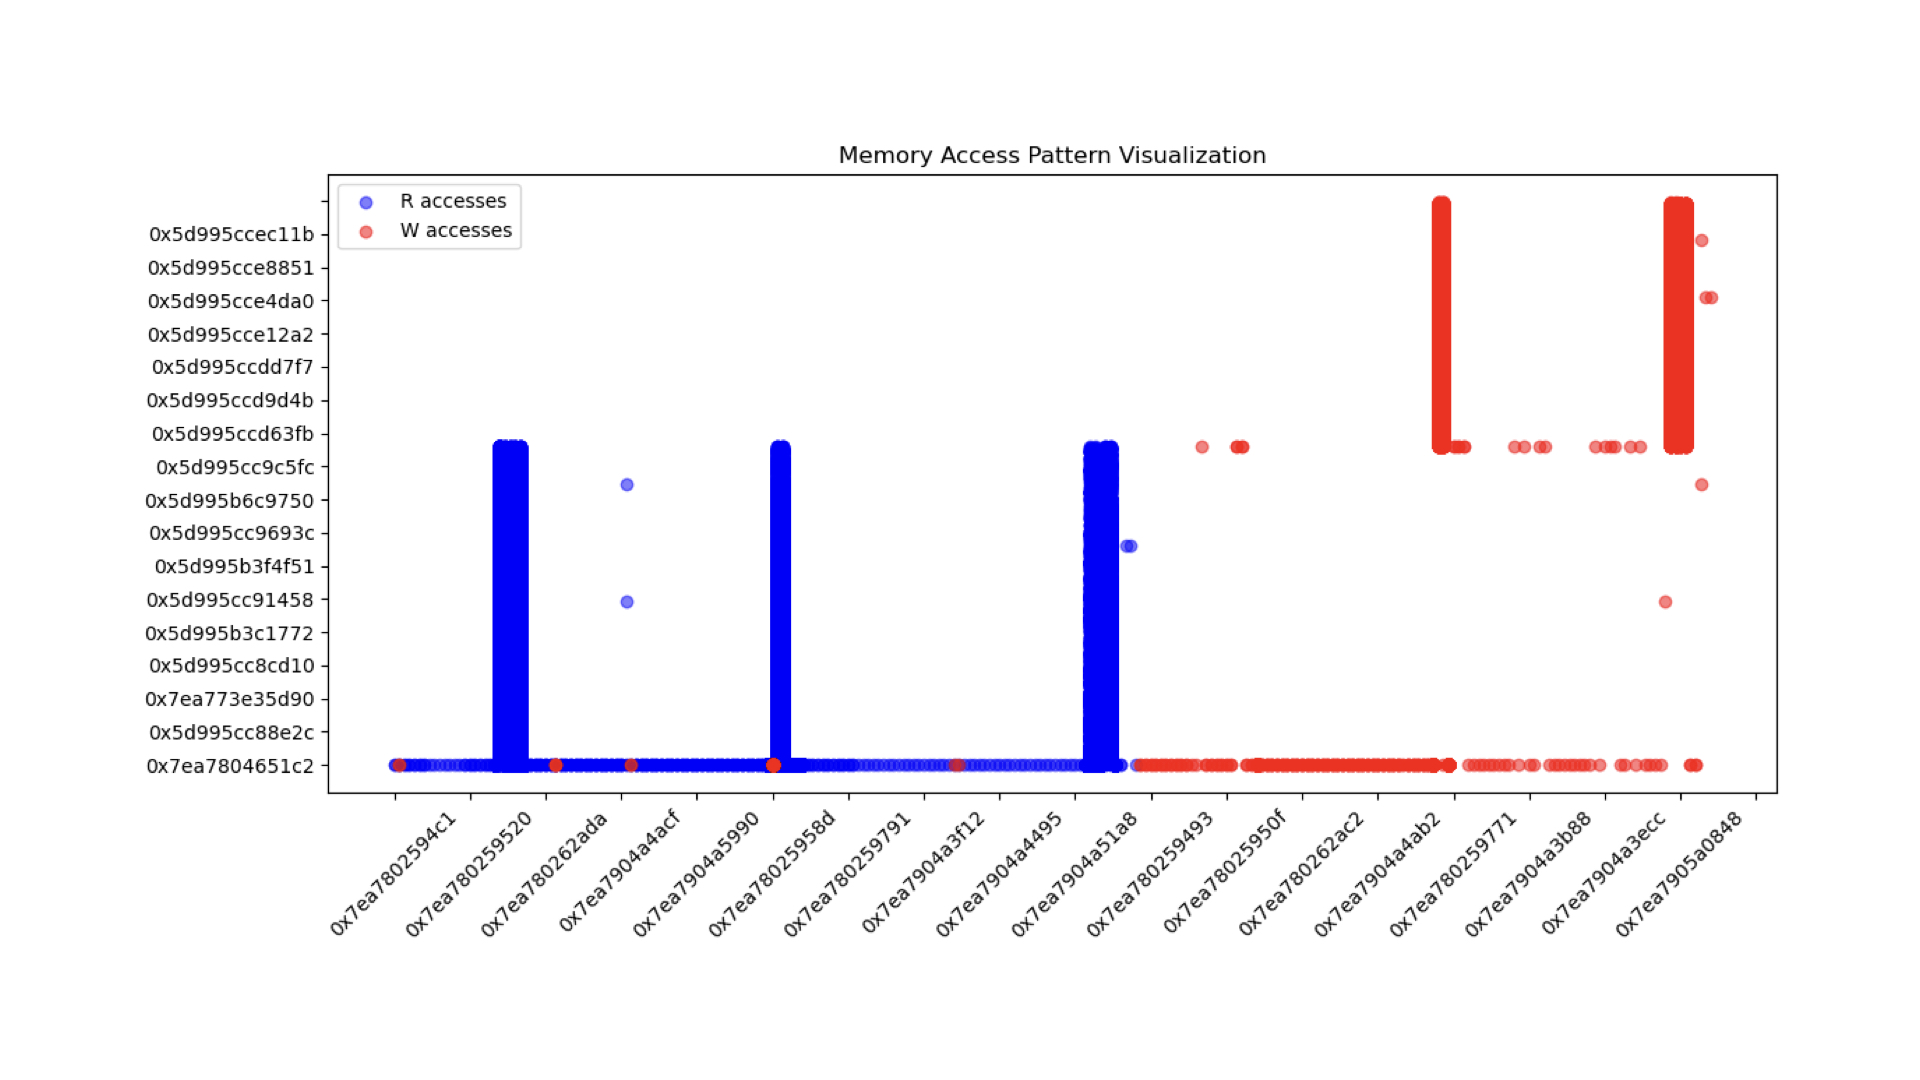
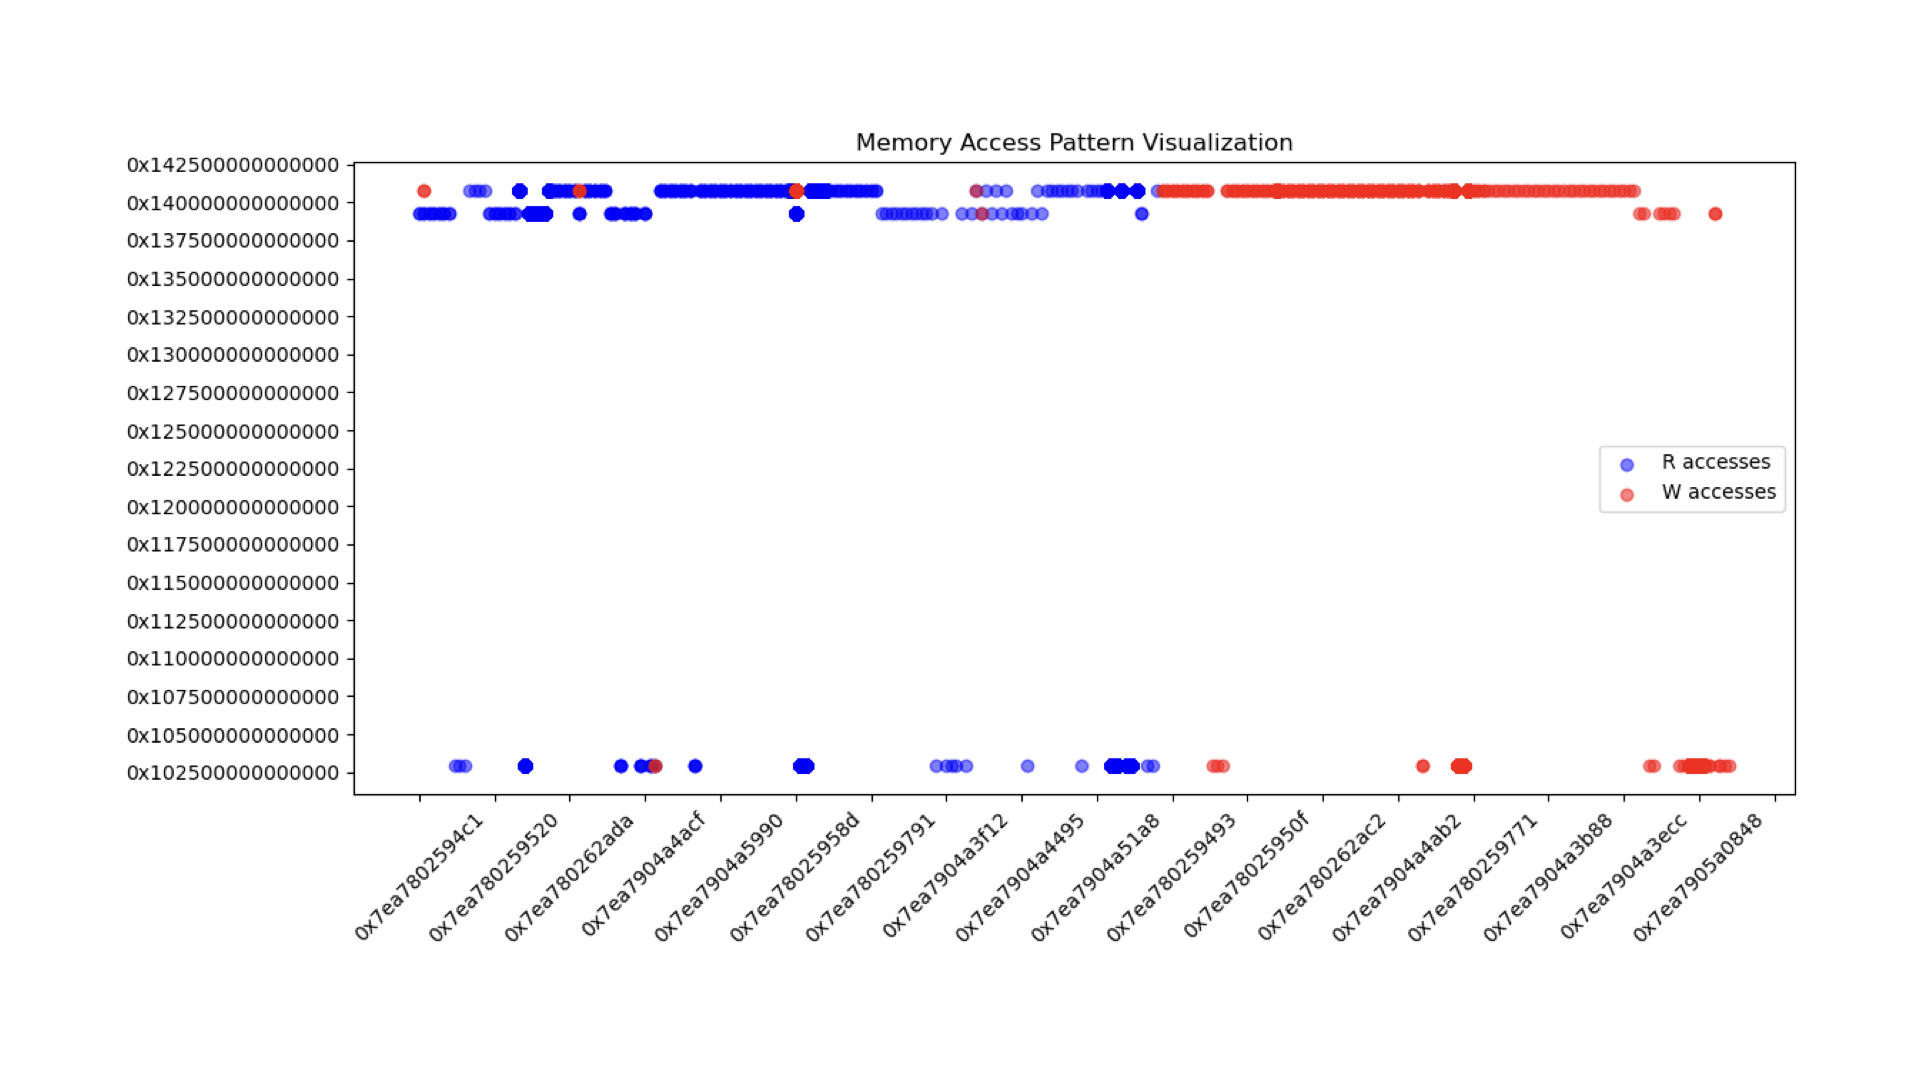
- 파이썬 코드가 도는 동안, 메모리 access를 tracing
- head -n 100 pinatrace.out
- 대용량파일은 이렇게 끊어서 빠르게 내용 확인하기
https://github.com/jingpu/pintools/blob/master/source/tools/ManualExamples/pinatrace.cpp
pintools/source/tools/ManualExamples/pinatrace.cpp at master · jingpu/pintools
Contribute to jingpu/pintools development by creating an account on GitHub.
github.com
* UPDATE


* 다음 랩미팅까지
- txt input 불러오는 메모리 주소 출력하기 (rust 파일에서) -> 순차적인 호출이랑 encoding 과정 분리하기
- x 축 CPU Cycle 가져오기 or int 카운터 선언해서 그리기
'ComputerScience > ProcessingInMemory' 카테고리의 다른 글
| [PIM] Embedding Look-Up Build (0) | 2025.05.13 |
|---|---|
| [Pin] Encoding Memory Visualization (2) | 2024.10.22 |
| [PIM] CPU/DPU Programming Code Review (5) | 2024.07.16 |
| [PIM] HEAM: Hashed Embedding Acceleration Using Processing-In-Memory (0) | 2024.06.25 |
| [PIM] Processing-in-memory: A workload-driven perspective (0) | 2024.05.21 |